In our Solar Landmarks series, we explore solar designs for landmarks around the world—such as Buckingham Palace, the White House, and the home of Canada’s Governor General—all from the comfort of the Aurora office.
For the past four years, that office has been in Palo Alto, but starting this week we are excited to have new offices in San Francisco that will give us room to grow as we work to bring you the most robust solar design and sales software in the industry.
With that in mind, for this Landmark article, we decided to set our sights a little closer to our (new) home and use Aurora to model a solar design for San Francisco’s iconic City Hall.
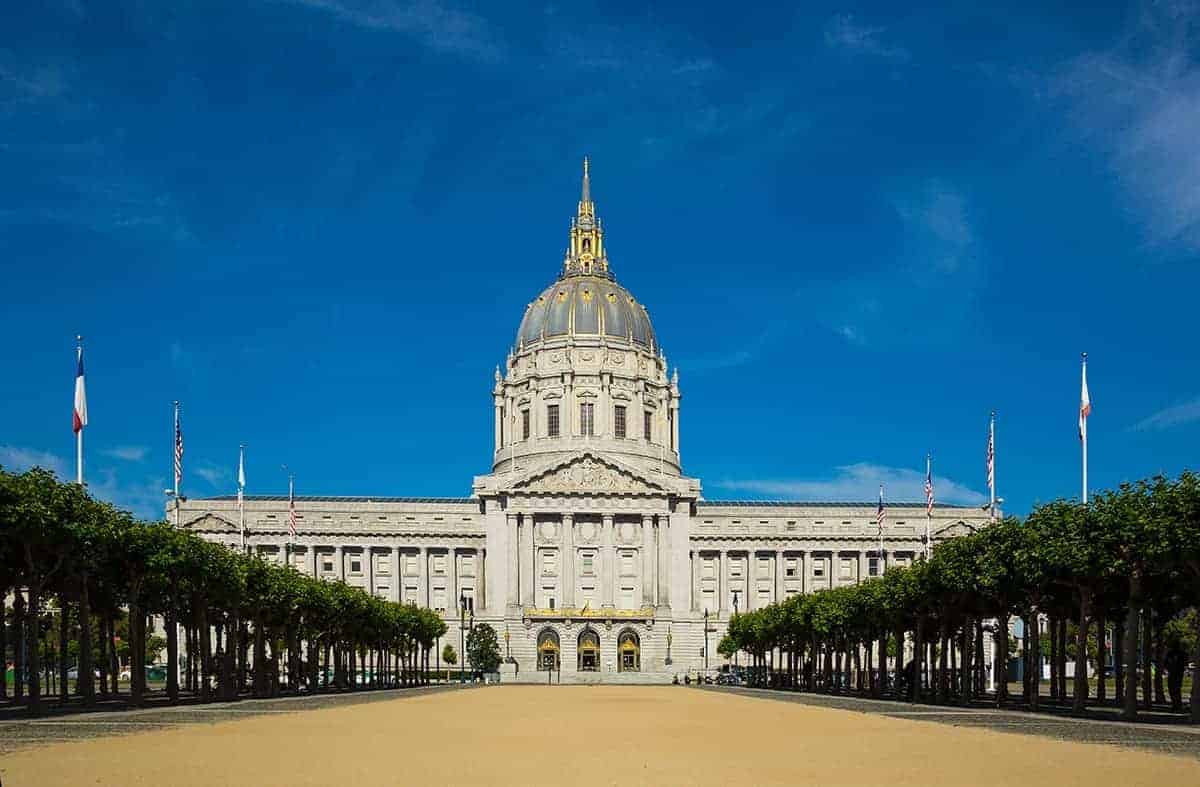 San Francisco City Hall.
This complex building gave us the chance to flex our 3D modeling skills using Aurora’s SmartRoof tool—and an opportunity to get familiar with some of the city’s efforts to advance clean energy and sustainability.
About the Building
Featuring an impressive dome, a grand staircase in the central hall, gilt exterior detailing, and white marble interiors, this beautiful building was part of an effort to showcase the rebirth of San Francisco after the Great Earthquake and Fire of 1906. It’s completion timed for the the start of the World’s Fair of 1915.
Today, City Hall showcases San Francisco achievement in a different way—with a 80 kW solar array that demonstrates local commitment to renewable energy and reducing greenhouse gas emissions.
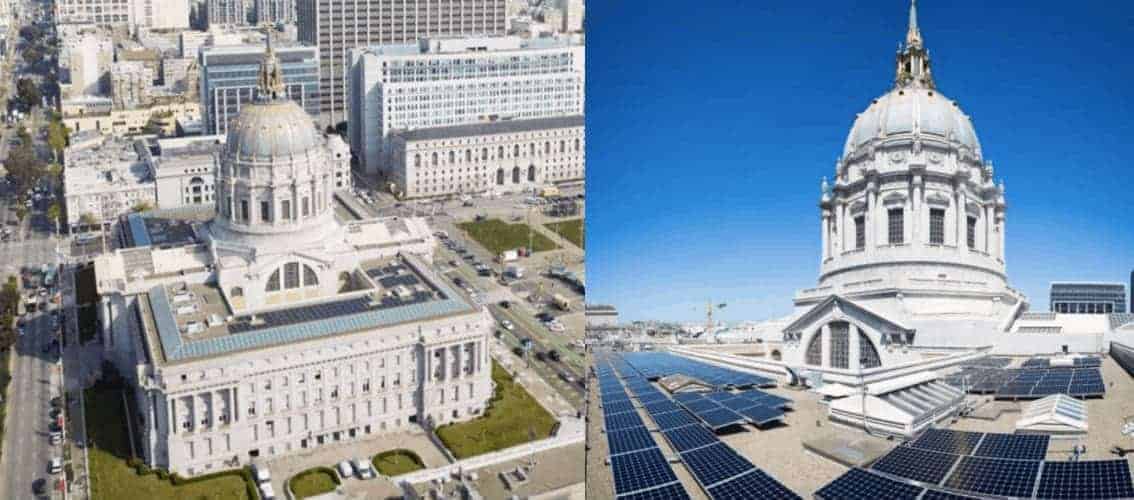 Views of the solar array on San Francisco City Hall. Photo credits: SFPUC, Robin Scheswohl (left), SFPUC (right). Source: 2015 Energy Benchmarking Report, San Francisco Municipal Buildings.
Leadership by City Hall makes sense. San Francisco has set ambitious clean energy targets, with a goal of sourcing 50% of its electricity from renewable sources by 2020 (ten years earlier than the deadline for California’s equivalent target). Although power for municipal buildings comes from carbon-free hydropower, City Hall’s solar array contributes additional clean energy to the city’s energy mix.
Determining City Hall’s Energy Consumption
We began our design process by seeking to understand how much electricity City Hall uses. Sometimes, it takes a little detective work to find energy consumption data for our Solar Landmark articles since, unlike a typical solar customer, we don’t have their electricity bill data to plug into Aurora’s consumption portal.
This time, our work was simplified, however, because San Francisco requires owners of non-residential buildings over 10,000 square feet to publish energy consumption data each year. The city publishes this data for municipal buildings in its annual Energy Benchmarking Report.
Because City Hall’s solar array was installed in January 2015, we looked at the 2014 report for the building’s pre-solar energy consumption. The city reports this energy consumption data in the form of Energy Use Intensity (EUI) values in the units of kBtu/sq. ft. This normalized data makes it easier to compare the energy efficiency of buildings of different sizes, and provides a standardized benchmark to assess improvements over time.
City Hall’s EUI in 2014 was 39.4 kBtu/sq. ft. and the square footage of the building is 516,484. This allowed us to determine that an electricity usage of 5.96 GWh per year (for our math, see notes at the end of the article ). While this is quite a lot of energy, the EUI values are in the normal range for commercial buildings. The city is working on increasing building energy efficiency to reduce the energy consumption of municipal buildings like this one (one goal of the annual benchmarking reports). All the more reason solar on City Hall is an exciting addition!
Modeling the Building
An accurate site model is the basis for designing an optimal solar array and modeling its energy production. To model this intricate building, we turned to one of Aurora’s resident solar design experts—Research Engineer Andrew Gong.
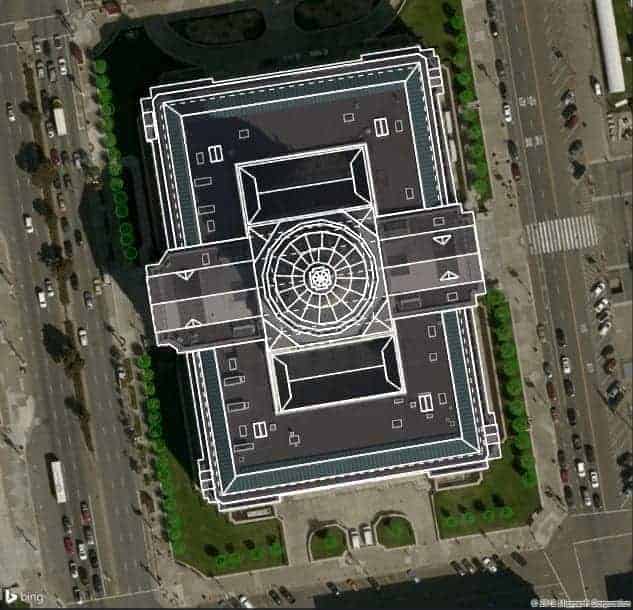 A top-down 2D view of our Aurora model of San Francisco City Hall.
Andrew used Aurora’s SmartRoof tool to create the building from a number of simpler parts as detailed below. SmartRoof seamlessly merges together component sections when they are dragged together, making it possible to create a precise design of even the most complicated buildings. (For more detail on the specific steps Andrew took, see the diagram below.)
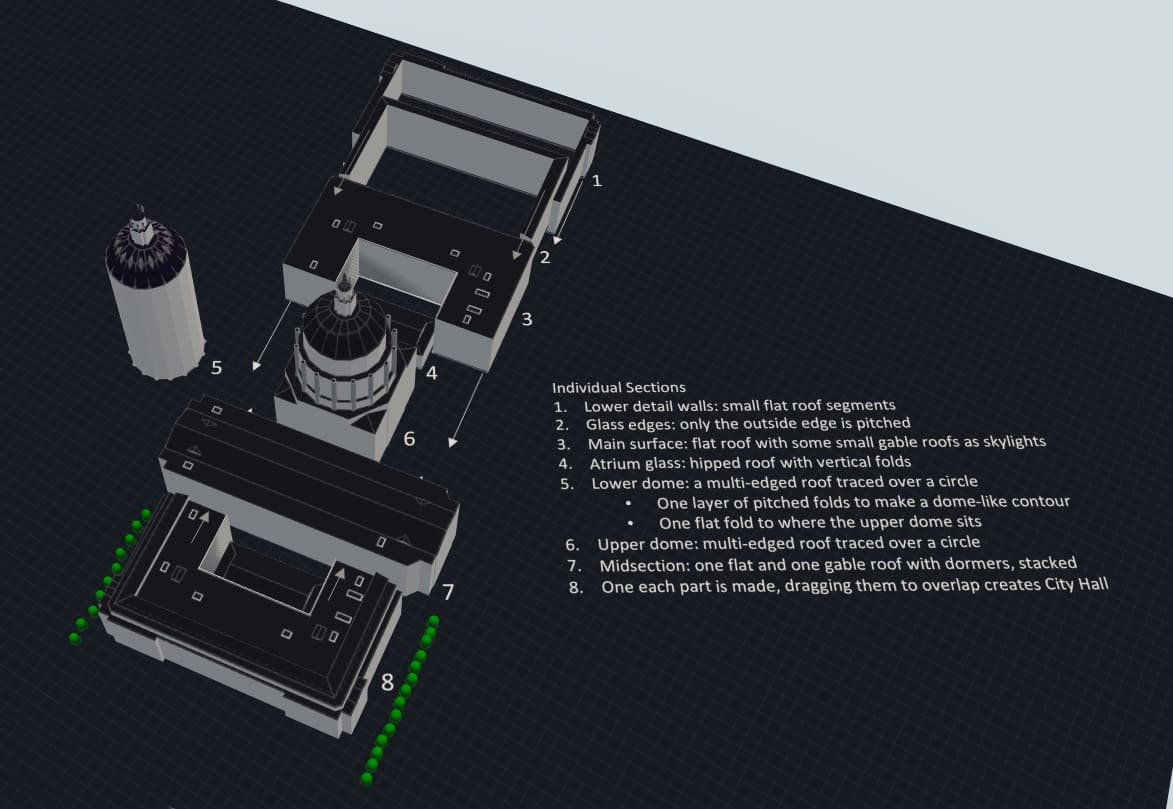 An overview of the process of designing San Francisco City Hall in Aurora, by creating simpler component sections and merging them together with SmartRoof.
From there, Andrew used Aurora’s Add Obstruction tool to account for the variety of vents, skylights, and other structural elements that pepper the roof, which would prevent placement of solar panels. While not tall enough to shade the roof, the rows of trees on three sides of the building were added for good measure.
The result is an impressive 3D site model:
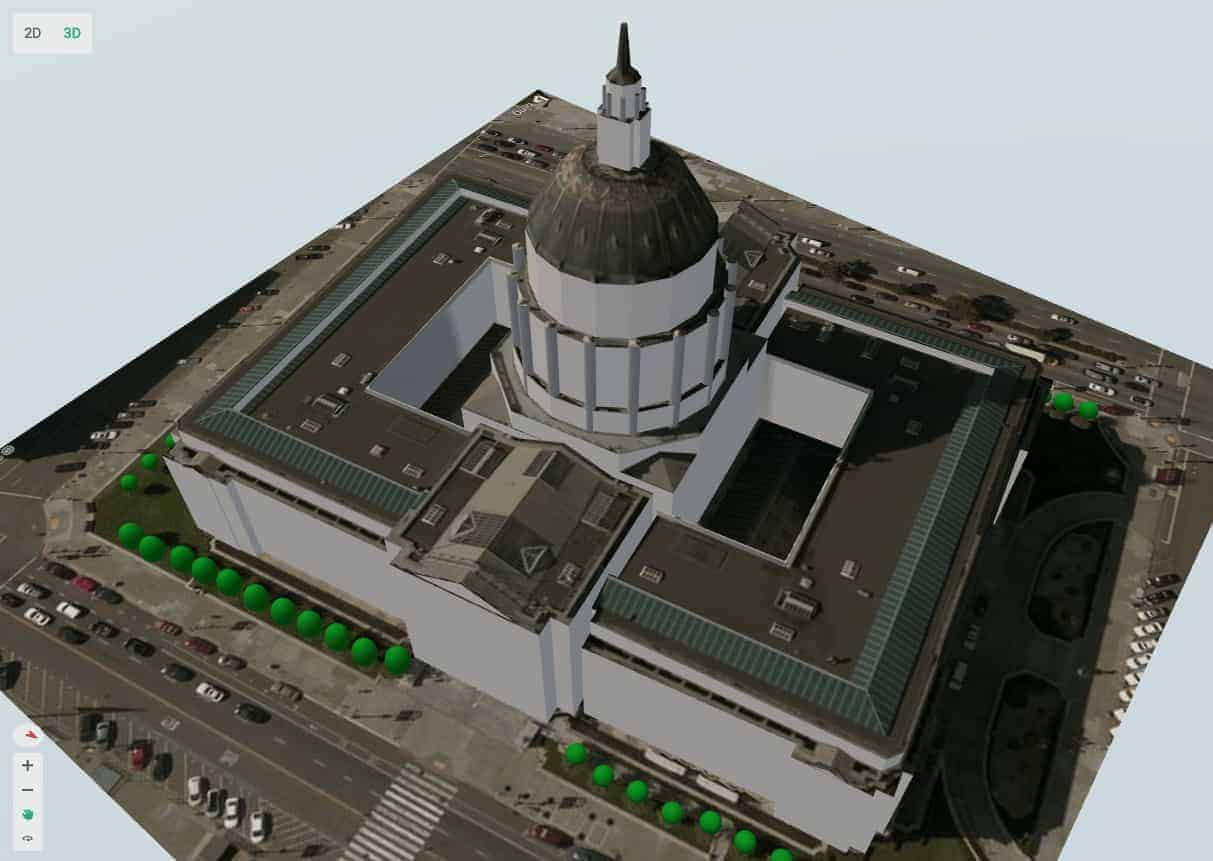 A 3D model of San Francisco City Hall created in Aurora.
Assessing the Roof
As you can see in the site model, the large rotunda in the center of the roof makes placing solar panels in that area impractical, as do recessed areas to the left and right of the dome. However, two large flat areas of roof space on either side of the dome provide ample room for a solar array.
As shown in the irradiance map produced by Aurora’s shading engine (below), while there is some shading from the rotunda, overall the roof has relatively high irradiance making it a good candidate for solar. As expected, the southern roof face—which was selected for the site’s current solar array—has slightly higher irradiance with solar access values of approximately 95% across much of the surface.
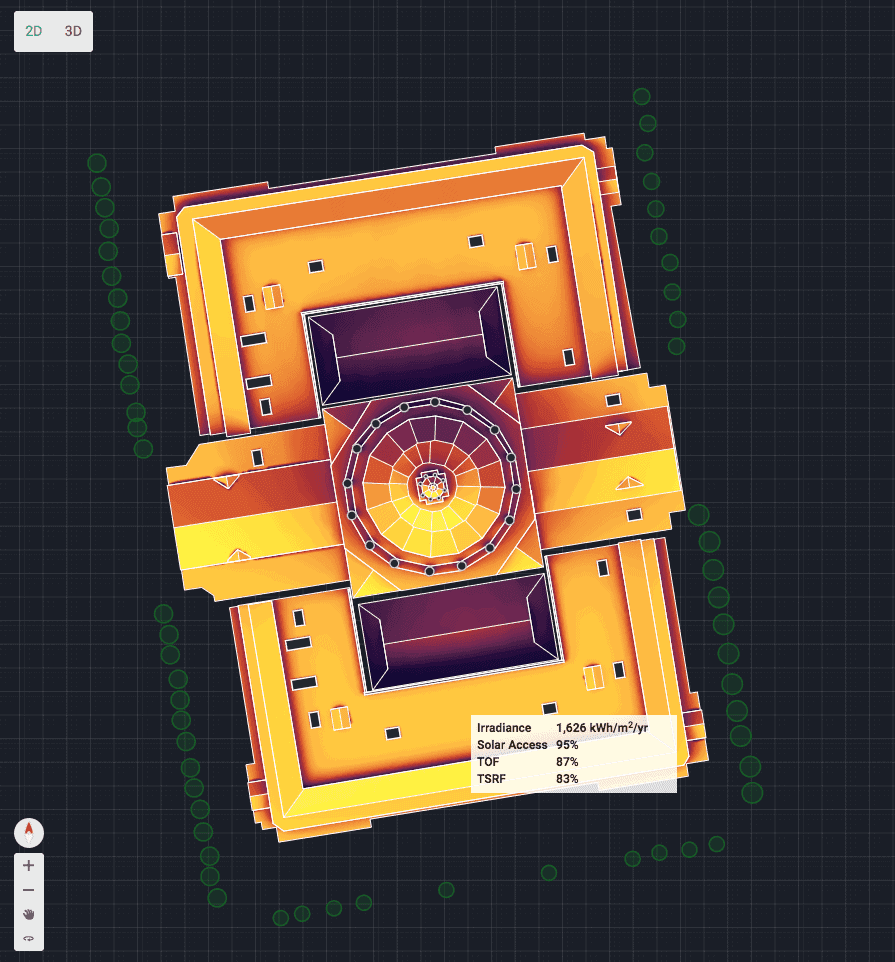 Aurora’s shading engine determines irradiance levels with accuracy that is statistically equivalent to on-site shade measurements, according to analysis by NREL.
About the System Design
In most of our Solar Landmarks, we create theoretical solar designs for sites that lack them—but since City Hall already beat us to the punch, we decided to model the existing array as precisely as possible and then explore how much energy it produces.
While we had limited data on the specifications of the installed design like the exact modules used, we were able to use a few pieces of information in combination with satellite imagery to create a design that closely matches the real system.
The San Francisco Public Utilities Commission reports that it is an 80 kW system comprised of 230 panels. This allowed us to determine the approximate wattage of the panels (80,000 watts/230 panels= 347.8 watt panels). We also knew that the system used high-efficiency modules.
Based on this, we input high-efficiency 345 W custom modules which are in the appropriate wattage range. We overlaid them on the roof over recent aerial imagery showing the installed panels and found them to be a match in size.
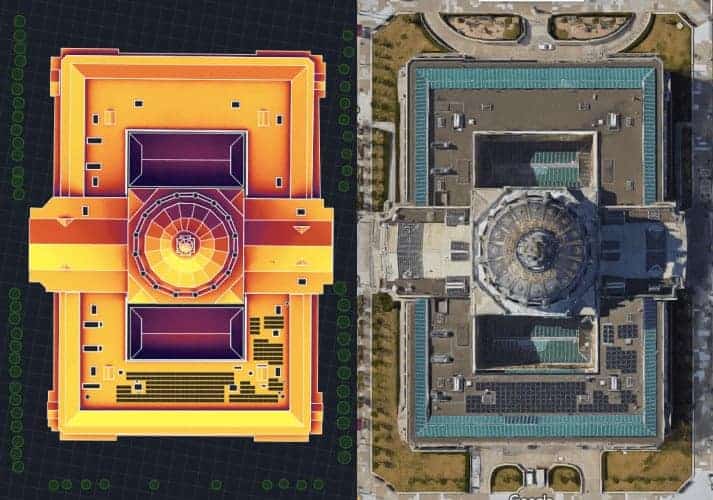 A comparison of our solar design and aerial imagery the installed design on City Hall.
From there, we used trial and error to find the correct spacing between each module and row of modules. We determined spacing of 1 inch between panels and 16 inches between each row matched the current design. We also estimated a tilt of 10 degrees based on close-up photos of the array.
Finally, we placed 230 panels in the same configuration as the real design, using aerial imagery of the system as our guide. There you have it—San Francisco City Hall’s solar array:
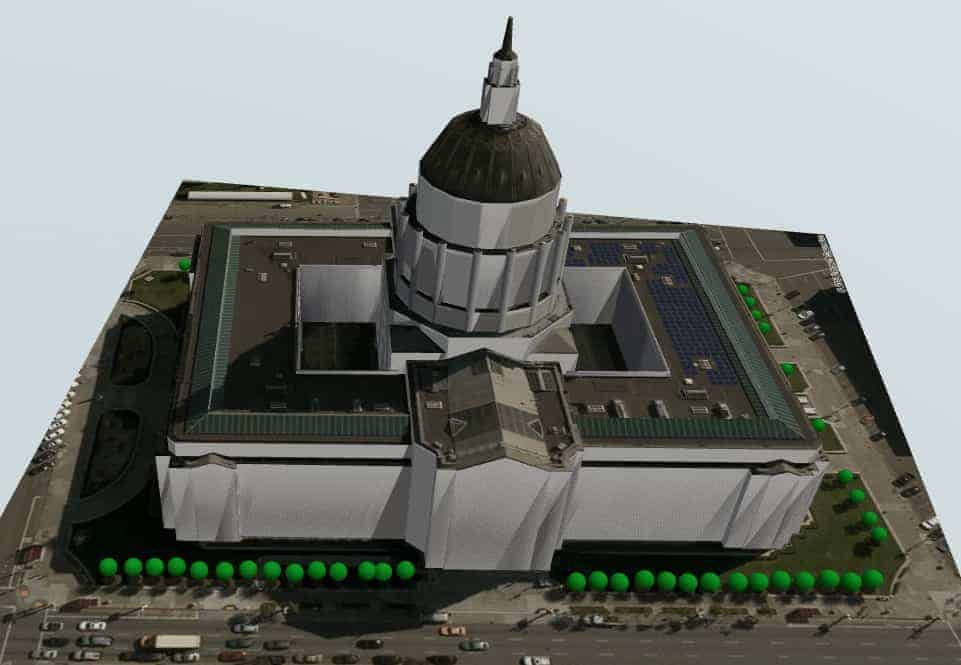 A 3D model of San Francisco City Hall with its solar array precisely recreated in Aurora.
Analyzing System Performance
With the design carefully recreated, we used Aurora’s Performance Simulation feature to model the expected energy production of the system, taking into account shade at each hour of the day as well as local weather data and the system configuration. Aurora predicts an annual energy production of 116,622 kWh.
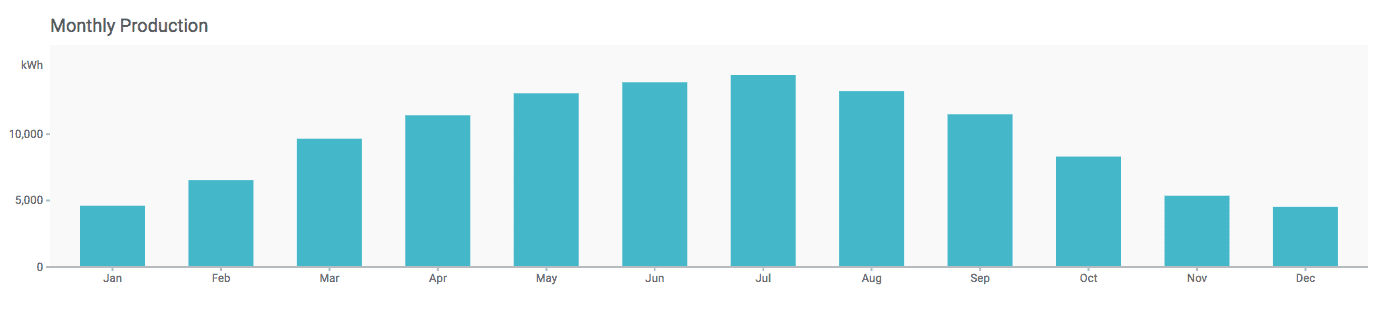 Aurora’s simulation of monthly energy production of City Hall’s solar array based on the system configuration, shading, and local weather data.
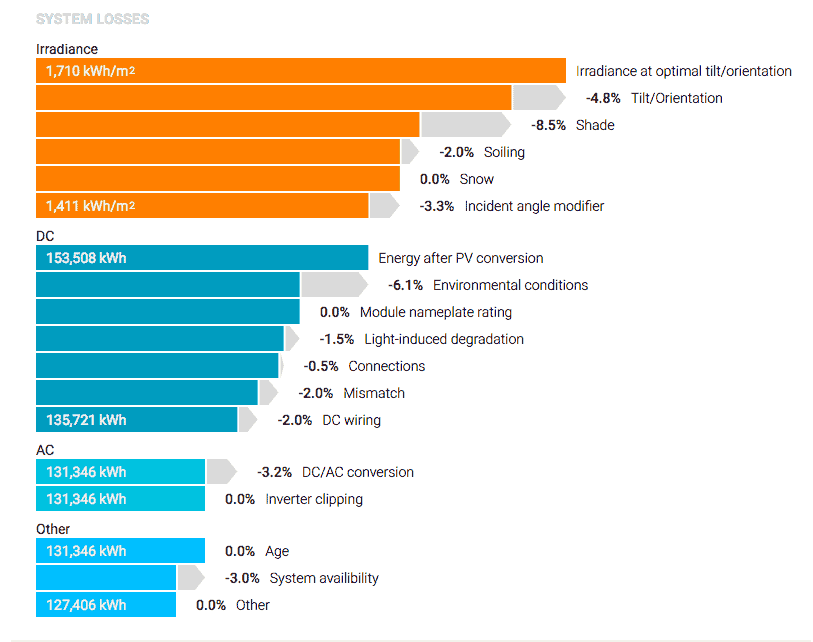 Aurora also calculates energy production losses from a variety of different sources, which it presents in a system loss diagram like the one above for City Hall.
While this is only a tiny percentage of the building’s large annual energy consumption (about 0.2%), the array offsets the carbon equivalent of 13 homes’ electricity use for one year or the consumption of 201 barrels of oil. The carbon savings are also comparable to the carbon sequestered by 102 acres of U.S. forests in one year.
Of course, in this case, since City Hall is powered by clean hydropower, the system isn’t directly offsetting emissions, but by making hydropower that would have been consumed available to other buildings in San Francisco it is still offsetting other, less sustainable energy consumption further down the line.
We’re excited to be starting a new chapter of our company in San Francisco and hope you’ve enjoyed this design in honor of our new city!
P.S. Is there a landmark you’d love to see a solar design for? Let us know in the comments below!
Acknowledgements: Special thanks to Andrew Gong for making this article possible by creating the model of City Hall and for providing significant guidance on the system design and other details of the article.
Notes on our methodology for calculating City Hall’s energy consumption:
- kBTU equals 1,000 BTU
- Conversion rate: To convert BTU to kWh multiply by 0.000293
- 39.4 kBtu/sf/yr *1000= 39400 BTU/sf/yr * 516,484 sf= 20,349,469,600 BTU/yr * 0.000293 kWh/BTU = 5,962,395 kWh per year = 5,962.39 MWh per year = 5.96 GWh per year